After what seems like an eternity, the end of the election campaign is finally in sight. The last of the leaders’ debates – a special Question Time in which David Cameron, Ed Miliband and Nick Clegg sought to defend their records and sell their programmes – has taken place. The jostling for post-election ministerial positions, not to mention coalition bargaining, is well under way. It is now a matter of days before millions of people cast their vote. Or will they? Just how bad will the turnout be on Thursday?
Political commentators have, understandably, expressed both concern and consternation that so few people vote in British elections. In the first bout of elections for police and crime commissioners that took place in 2012, the average turnout hovered around 15 per cent. In some areas the figure was closer to 10 per cent. This was likely due to the fact that the posts were new and relatively unknown, but other contests have faired little better. The 2012 Manchester Central by-election, for instance, saw just 18 per cent of voters choose Tony Lloyd’s replacement – the lowest turnout in British political history. Three other by-election battles held that same year – in Cardiff South and Penarth, Croydon North, and Middlesbrough – were marginally better but still drew fewer than 27% of voters to the polls. Turnout for the 2014 European Parliament elections was likewise poor, with a figure of 34 per cent comparing unfavourably to 60 per cent in Italy, 56 per cent in Denmark, 52 per cent in Ireland, 48 per cent in Germany and 44 per cent in France.
Of course, such figures have to be taken with caution. By-elections and European Parliament votes have traditionally seen lower turnout than their general counterparts, in large part because they provoke far less media coverage and public interest than nationwide general elections.
Yet even the three most recent general elections have seen fewer people heading to the polls. As Figure 1 below demonstrates, the 2000s has been a period marked by voter inactivity. The first indication of serious apathy among the electorate was the June 2001 general election, when turnout fell nearly 12 per cent compared to the 1997 vote and edged below the 60 per cent mark for the first time in the post-war period. The figure is not too difficult to explain: New Labour’s victory appeared a certainty; the pre-Iraq Tony Blair was still a popular prime minister; the Conservatives, then under the leadership of William Hague – described by The Sun as a ‘dead parrot’ – appeared to be a gaffe-prone party still deeply split over Britain’s EU membership. Turnout, it is doubtless true, recovered somewhat in the 2005 and 2010 votes, but the figures were still well below the average for the 1945-1992 period.
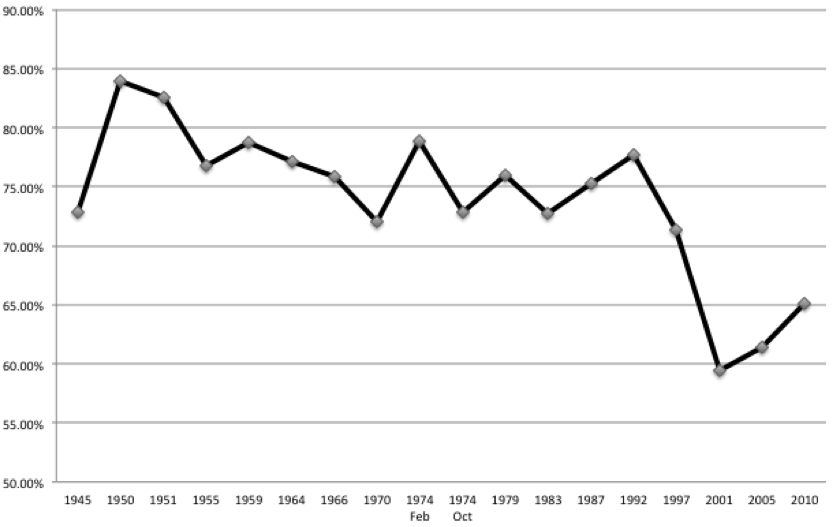
Figure 1: General election turnout since 1945
But, as with every statistic, the devil is very much in the detail. Take the last general election in 2010 as an example. The overall turnout was a little over 65 per cent, higher than in 2001 and 2005 but still low by historical standards. However, this figure belies the complex story of Britain’s voter turnout and the very clear variations across age, sex, occupation and colour.
The graphs and table below begin to tease out such intricacies. Figure 2, for example, demonstrates that the vast majority of registered older voters – 73 per cent in the case of those aged between 55 and 64, rising to 76 per cent of those aged 65 and over on the day of the election – turned out to cast a ballot. In comparison, the figure for first-generation voters, those aged between 18 and 24, was just 44 per cent. Look no further for reason why Ed Miliband recently visited Russell Brand.
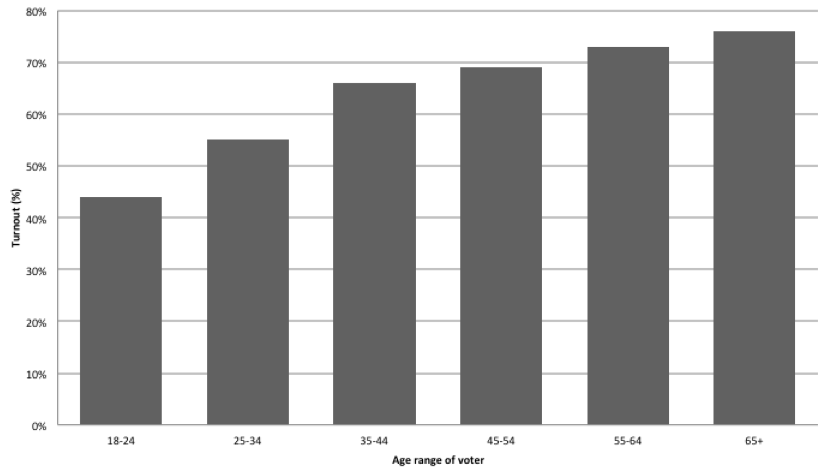
Figure 2: turnout at the 2010 general election based on age
The divergence is even starker if you break the age groups into male and female voters. As Figure 3 reveals, in 2010 both younger and older men were more likely to vote than their female counterparts – even though women make up 52 per cent of the British electorate. In the case of 18-24 year olds, the gap was 11 per cent, with 50 per cent of men registered to vote in the age category actually casting a ballot compared to just 39 per cent of women. This might explain why Labour’s deputy leader, Harriet Harman, has been touring the country in the pink (yes, it’s pink – Harman confirmed as much last week) ‘women to women’ battle bus.
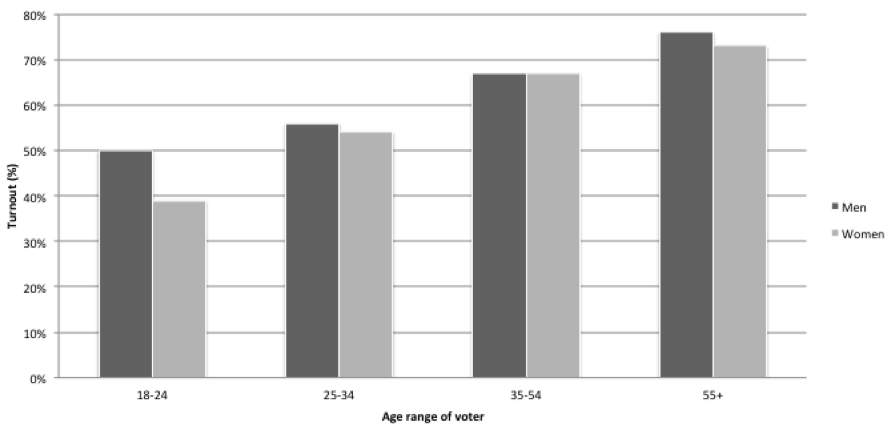
Figure 3: turnout at the 2010 general election based on sex
Leaving aside the issue of age for one moment, the voting figures from the 2010 election similarly reveal a huge divide in turnout depending on occupation and ethnicity. Take the first set of figures from Table 1 below, showing categories according to the NRS social grading system. The results show that there was a clear correlation between occupation and likelihood to vote. Those from the AB group (higher managerial, professional and administrative positions) were proportionally more likely to turn up in a voting booth than those classed C1 (supervisory, clerical and middle management), C2 (skilled manual worker) and DE (semi-skilled, unskilled, casual worker or non-worker).
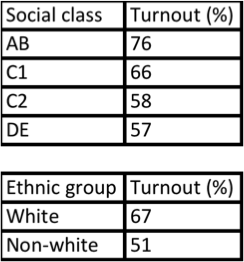
Table 1: turnout at the 2010 general election based on social class (occupation) and ethnic group
And the same goes for ethnic background. While there was great divergence between regions – London for example had a higher proportion of non-white voters than the national average – overall there was a 16 per cent disparity between white and non-white registered voters choosing to cast a ballot on polling day. Put another way, if in 2010 you were a white male aged over 65 with a managerial or professional background, you were much more likely to vote than if you were a young black semi-skilled, unskilled or jobless female.
Who, then, will likely vote on 7 May? Will turnout be as disappointing as it has been in the last few elections? I think there’s reason to suspect that the overall figure may not be as bad as some fear. Returning to Figure 1 above, which shows the overall turnout at every general election since 1945, the trend certainly shows that as time has progressed fewer people have chosen to go out and choose their local MP. But the graph also tells another tale that might give reason to think that turnout this time around will in fact improve, not shrink.
Think of some of the most closely fought elections battles since 1945: the vote in February 1950 (when Labour under Clement Attlee won just a five seat majority); the ‘who governs Britain’ election of February 1974 election (when Labour’s Harold Wilson saw his party gain fewer votes but more seats than his rival, Conservative prime minister Edward Heath); and the first post-Thatcher election in 1992 (when, despite all the predictions of a hung parliament, John Major won a workable majority of 21 seats over Neil Kinnock of the Labour party). In each of these, the competition between the two biggest parties was fierce and the probable victor uncertain. But where this was the case, voter turnout was higher than the elections that preceded them. In other words, the less certain an outcome, the more likely people will vote.
I mentioned in a recent post that opinion polls give us a better indication than some would argue as to the likely state of the parties come 8 May. This remains true, but any way you look at it they still point to a hung parliament. But if history tells us anything, it is that this uncertainty should translate into an improved turnout. And there are already signs that this will indeed be the case. More people than ever before have registered to vote in Thursday’s election. This is on the back of the September 2014 Scottish referendum, where turnout reached 90 per cent in some areas. The period of voter inactivity might, then, finally be at an end. But exactly who and how many will vote, and the party they will vote for, will only become clear this week.
